Progress
MSD is working to reduce combined sewer overflows (CSOs) into our local rivers and streams, eliminate sanitary sewer overflows (SSOs), and address sewer backups into homes and businesses.
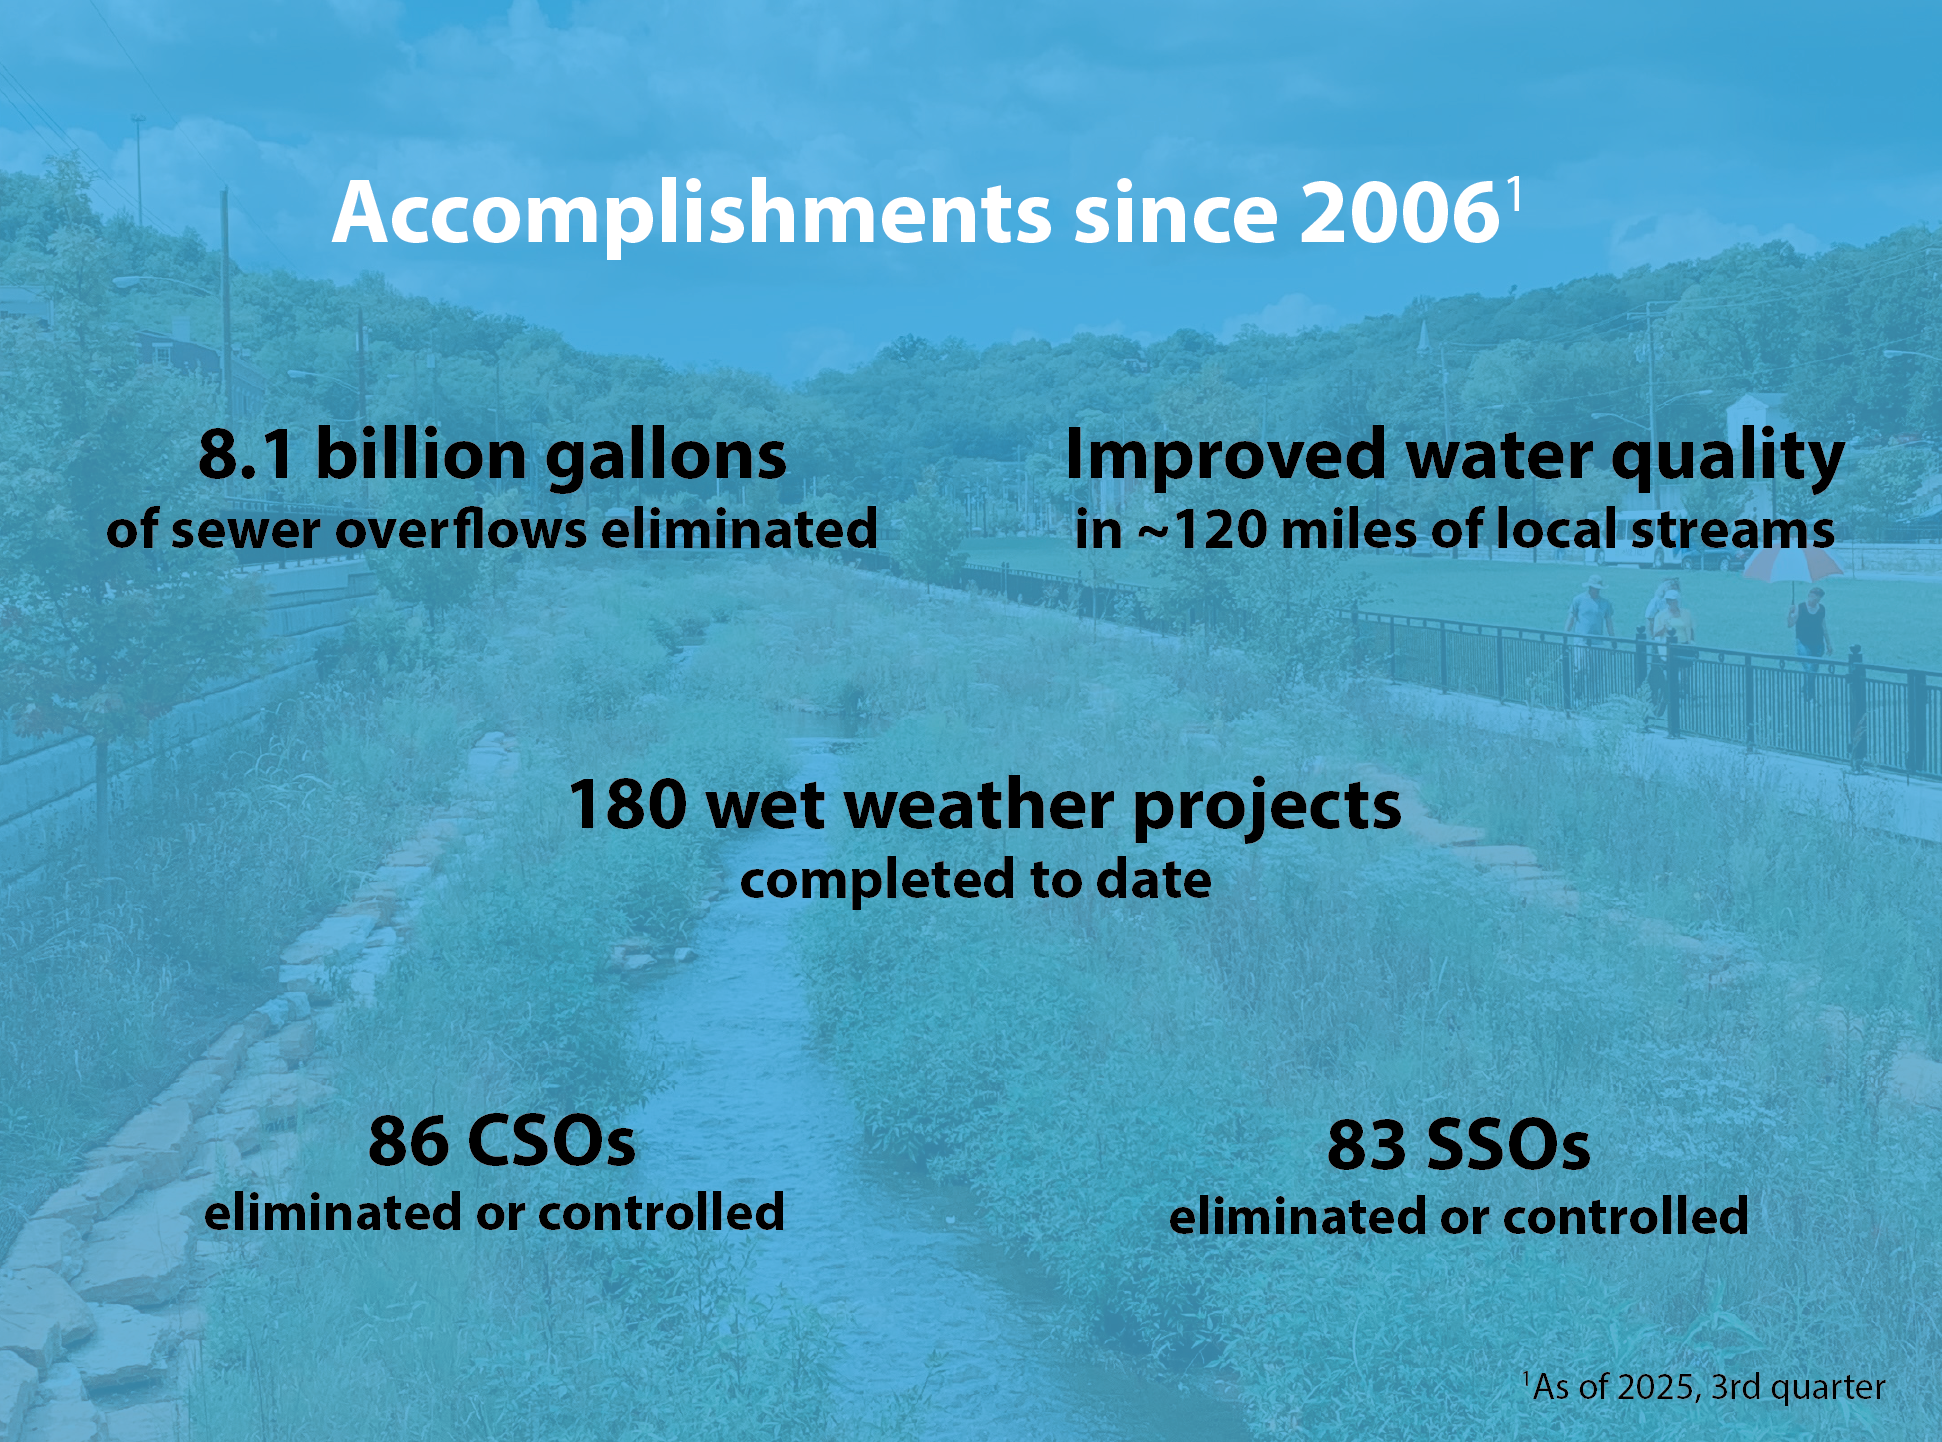
To date, MSD has:
- Reduced CSOs by about 8.1 billion gallons annually (from 14 billion down to 5.9 billion gallons a year during a typical year of rain)
- Made significant improvements in eliminating SSOs
- Operated a Sewer Backup (SBU) Program since 2004 to help customers mitigate the impacts of sewer backups caused by the public sewer
MSD is currently working on Phase 2B of our wet weather program. Approved in July 2025 by the U.S. EPA, this phase runs from 2025 - 2035 and includes six projects that will eliminate about 1.5 billion gallons of CSOs annually.
Please see the information below, which includes an overview of progress to date on our wet weather program, links to view or download reports related to our wet weather program, and several dashboards related to sewer overflows.
In addition, there is information on MSD's capital program, which includes both wet weather and asset management projects.
PROGRESS ON WET WEATHER PROGRAM
Phase 2B (2025 - 2035)
Phase 2B, approved by the U.S. EPA and other regulators in July 2025, includes the construction of six projects over an 11-year period between January 1, 2025, and December 31, 2035. The plan is anticipated to achieve a 1.5-billion-gallon reduction in CSOs during a typical year. VIEW THE PHASE 2B APPROVAL LETTER AND SCHEDULE
The Phase 2B projects include:
Mill Creek Bundle:
- Mill Creek WWTP High Rate Treatment Pump Station: New 700 MGD pump station to connect the recently constructed diversion chamber to the treatment plant and an upgraded disinfection system. VIEW MILL CREEK PUMP STATION PROJECT PAGE
- East Branch Ohio River Interceptor Extension (EBORIE) in Queensgate: Construction of new storm sewers and new sanitary sewers to remove stormwater from the combined sewer system. Overflows will be eliminated at CSOs 489 and 432 and reduced at CSOs 430, 431, and 666. Design and construction coordination with the Ohio Department of Transportation (ODOT) in coordination with the Brent Spence Bridge project. VIEW EBORIE PROJECT PAGE
- Mill Creek WWTP Dewatering Building Improvements: New dewatering building with odor control for solids processing.
Little Miami Bundle:
- Little Miami WWTP Solids Disposal with Odor Control: Construction of an anaerobic digestion facility to convert waste solids into biogas and biosolids for beneficial reuse. Also upgrades to existing solids processing facilities, including odor control. VIEW ANAEROBIC DIGESTER PROJECT PAGE
- Little Miami WWTP Electrical, Primary, and Secondary Improvements: Upgrades at primary and secondary treatment to support increased wet-weather treatment capacity from 55 MGD to 100 MGD through secondary treatment; also replacement of electrical equipment that is beyond its useful life.
- Little Miami WWTP High-Rate Treatment (HRT) Facility: Site work to prepare for construction of an HRT (e.g., demolition of decommissioned buildings) and construction of an HRT facility with a treatment capacity of 115 MGD. Also upgrades to existing plant influent pumping and screening systems and disinfection. This will eliminate the bypass of wet weather flows at the plant during a typical year.
SBU Program
The SBU program offers 24/7 reporting of sewer backups, investigation of sewer backups to determine whether they were caused by the MSD public sewer, cleaning services for eligible properties, reimbursement of damages for eligible properties, and protection from future sewer backups for eligible properties.
MSD issues a monthly program report that provides information on the number of sewer backup reports received each month, the number of properties served by the program, and dollars spent.
VIEW SBU PROGRAM REPORT (UPDATED MONTHLY)
Phase 2A (2020 - 2024)
Phase 2A began in 2023 and was substantially completed in 2024. Phase 2A included the construction of three projects: the Mill Creek WWTP Diversion Chamber, CSO 402-406 Regulator Improvements, and the Little Miami WWTP Standby Power project. It also included design of two projects: a new influent pump station at the Mill Creek WWTP to serve a future High-Rate Treatment (HRT) facility and planning for improvements to the East Branch Muddy Creek Interceptor and associated pump stations.
Information about Phase 2A can be found in the Consent Decree Quarterly Reports (found on this page) under Appendix A (Phase 2A).
Bridge Plan (2019 - 2020)
The Bridge Plan, an interim phase between Phase 1 and Phase 2A, began in 2018 and was substantially completed in 2024. The Bridge Plan included 26 wet weather projects ranging from CSO eliminations and sewer separations to improvements to the SSO 700 high-rate treatment facility and pump station upgrades.
Information about the Bridge Plan can be found in the Consent Decree Quarterly Reports (found on this page) under Appendix A (Bridge).
Phase 1 (2009 - 2018)
Phase 1, which began in 2009 and was substantially completed in January 2020, included 133 wet weather projects ranging from sewer replacements and sewer separations to pump station eliminations and treatment plant upgrades.
Of those projects, 20 were focused on the lower reaches of the Mill Creek where a disproportionate number of CSO outfalls are located, including CSO 5, then the largest volume overflow point in MSD’s service area. The most recognized project, the Lick Run Greenway in South Fairmount, looks like an urban park with a surface stream but significantly reduces overflows from CSO 5.
In total, Phase 1 eliminated nearly 8 billion gallons annually of sewer overflows from across MSD's service area.
Phase 1 was completed at a cost of about $961 million (in 2006 dollars) and $1.08 billion in 2024 dollars. As the estimated cost of Phase 1 was $1.14 billion (in 2006 dollars), this phase came in under budget.
LIST OF PHASE 1 PROJECTS AND COST SUMMARY (INDICES 1-119)
CSO ACTIVITY MAP
Any CSO outfall that is suspected to be actively discharging or is suspected to have discharged in the last 72 hours is shown on the map below. Data is updated once every hour. Please remember to refresh your browser frequently to see the most up-to-date information.
For more information, please visit the CSO Notification webpage
Map Legend:
- Currently Active: Remote monitoring indicates a CSO may be occurring at this location.
- Recently Active: Remote monitoring indicates a CSO may have occurred within the previous 72 hours, but water levels have returned to a normal elevation.
- Flooded: The local creek or river level is elevated and may be entering the combined sewer system at this location
- Data Unavailable: The CSO outfall was in an active or flooded state within the last 72 hours, but data is no longer accessible, so the status is unknown.
NOTE: MSD maintains an advanced system of sensors that monitor the conditions at all CSO outfalls. Data is available once every hour, so while the CSO Activity Map isn’t a “live” video feed, it shows the conditions in near real-time. While the system is highly reliable, there still can be false alerts. MSD reviews this data daily and reports all confirmed overflows to the Ohio EPA within 24 hours.
CONSENT DECREE REPORTS
For detailed information on MSD's Wet Weather Program, including budget, schedule, performance metrics, potential project risks, etc., please view or download the reports below:
Consent Decree Quarterly Reports (select a report from the list below). Please see the appendices for specific information about Phase 1, the Bridge, and Phase 2A.
Consent Decree Annual Reports (select a report from the list below):
Other Reports and Plans (select a report from the list below):
OVERFLOW DASHBOARDS
Validated Overflow Occurrences (Discharges)
MSD reviews hundreds of monitored overflow points to confirm actual overflow occurrences at each outfall. This database shows dates of occurrences of validated CSOs, SSOs, Pump Station Overflows (PSOs), and Non-Enumerated Overflows (NEOs) since 2010. The database also includes calculated volumes for CSO discharges. MSD does not calculate volumes for SSOs, PSOs, or NEOs, so only occurrence dates are reported.
Click on a specific outfall to learn more or adjust the date range to narrow your search.
CSO Volumes
MSD reports all discharges from CSOs in its monthly Discharge Monitoring Reports submitted to the Ohio EPA. Since November 2023, MSD has used advanced data analysis tools to measure and categorize daily overflow volumes when the sewer system is under various conditions, such as: dry weather, wet weather, and flooded conditions.
Use the data filters to find information on specific CSOs.
Map Legend:
- WW OF: Wet Weather overflow volume reported within 24 hours of recorded rainfall in the contributing sewershed.
- DW OF: Dry Weather overflow volume reported with no recorded rainfall in the contributing sewershed.
- FL OF:Flooded overflow volume reported when local creek or river level is elevated and influencing the combined sewer system.
- AVAILABLE (%): Percentage of time that remote monitoring equipment was in service and reporting.
Note:
Overflow volumes for CSOs 005, 125, 482, and 487, which are located at real-time CSO control facilities, are not included in this dashboard. MSD is working to integrate them by early 2025. Their volumes are currently available in the Overflow Occurrences dashboard above; however, the total calculated overflow volume for each CSO event is divided equally over each day the event occurred.
WANT TO LEARN MORE?
CURRENT STATUS OF MSD CAPITAL PROJECTS
Most large-scale projects at MSD are funded through our Capital budget. Capital projects include Wet Weather Program projects to reduce sewer overflows and asset management projects to rebuild our aging sewer system.
MSD reports on the status of its capital projects on a monthly basis. This includes all active wet weather and asset management projects in planning, design, construction, final acceptance, or closeout.
MSD offers two ways to view this data:
- Capital Project Delivery Report (CPDR) - published monthly (select a report from the list below):
- Interactive database - updated monthly
Access the database You can sort (ascending/descending) each column of the database by clicking the small triangle underneath each header.